Kubernetes News
-
Open source maintainership in the age of AI
AI has really changed the game around software development. More people are leveraging AI than ever to contribute patches to projects they use. To me, this is a good thing as more folks will contribute patches rather than fork or not fix them. The main problem is that AI has made generating code fast but there has been very little improvement in maintaining code bases. In this post, we will highlight the ways the Kubernetes community is adapting to the world of AI assisted coding.
The first step of this journey was to develop an AI policy. This seems mundane and bureaucratic but there were many PRs that derailed into discussions around AI usage. The AI policy helps steer the conversation around the project's stance on AI and provides a clear signal to contributors on how to use these tools responsibly.
Kubernetes AI policy
The Kubernetes project has established clear guidelines for AI-assisted contributions that balance innovation with accountability. These policies are designed to maintain code quality and ensure human oversight while acknowledging that AI tools can be valuable aids in the development process.
Transparency first
Contributors must disclose when AI tools have been used to assist with a pull request. A simple statement in the PR description such as "This PR was written in part with the assistance of generative AI" is sufficient. This transparency helps reviewers understand the context and apply appropriate scrutiny.
Human accountability
While AI tools can assist, the human contributor remains fully responsible for every change. The policy explicitly prohibits:
- Listing AI as a co-author on commits
- Using AI co-signing on commits
- Adding trailers like "assisted-by" or "co-developed" that attribute work to AI
This isn't about diminishing AI's role as a tool—it's about maintaining clear accountability. If something breaks, there needs to be a human who understands why and can fix it.
CLA enforcement for co-authors
The CNCF provides a tool for verifying the contributor license agreements on each pull request. AI agents are not able to solve these contributor license agreements so one enforcement the project made is to enable the CLA check for co-authors. This provides a flag to reviewers that the PR is not ready to merge.
Human engagement required
Perhaps the most critical aspect of the policy: reviewers expect to engage with humans, not with AI. Contributors cannot rely on AI to respond to review comments. If you cannot personally explain changes that AI helped generate, your PR will be closed. This requirement ensures that knowledge transfer happens and that contributors genuinely understand the code they're submitting.
Verification obligations
Contributors must verify AI-generated changes through code review, testing, and personal understanding. It's not enough for the code to work—you need to know why it works and be able to maintain it.
These policies reflect a mature approach to AI: embrace it as a tool, but never let it replace human judgment, understanding, or responsibility.
Automated AI reviews
There exist many tools to aid in reviewing code. AI pull request tools introduce governance challenges so one of the first tasks the community took on was to document the process for what is needed to bring in new AI tools. One of the major evaluation criteria for these tools is to find maintainers willing to test drive them in kubernetes-sigs repositories. Kueue, JobSet and Agent-Sandbox have been experimenting with these tools to provide more support for maintainers.
Copilot
One tool that many maintainers started using was GitHub Copilot. The CNCF provides access for maintainers so this ended up being the first tool many started using. It provides some good experience on tuning reviews but there were some growing pains with this tool. The biggest blocker for community adoption is relying on contributors to have a copilot license. Only maintainers were able to request copilot reviews and automated reviews of pull requests was out of reach for the community. One of the goals of AI review tools is to provide an automated review tool that maintainers don't need to request. This demonstrated the need for organization control rather than relying on contributors having access.
CodeRabbit
In mid 2026, the Kubernetes community has rolled out CodeRabbit to a few projects. As with copilot, some tuning has been required to provide better reviews but the overall feedback has been positive. There is a lot of configuration available for this tool and one of the most interesting uses of this tool comes from agent-sandbox.
AI pull request tools can be a quality gate. Contributors can at least get a quick spot check review without waiting for a maintainer. Agent-sandbox has added a label on PRs to reflect that there is still a need to resolve some of the comments from AI tools.
Next steps
The reality is that leveraging AI in open source projects is an area of active exploration. The community could use your help in tuning reviews tools, evaluating tools or evaluating emerging technologies in the AI space.
Some areas we are exploring more:
- The use of AI skills to reduce maintainer burnout.
- AI assisted triage of failing tests.
- Skills to aid the operational aspects of Kubernetes.
-
Introducing the Cluster API plugin for Headlamp
Headlamp is an open-source, extensible Kubernetes SIG UI project designed to let you explore, manage, and debug cluster resources directly from a browser.
Cluster API (CAPI) is a Kubernetes sub-project that brings declarative, Kubernetes-style APIs to cluster lifecycle management. It lets platform teams provision, upgrade, and manage the lifecycle of Kubernetes clusters using standard Kubernetes objects stored and reconciled in a management cluster.
Managing Cluster API resources has historically required raw
kubectlcommands and deep familiarity with ownership hierarchies. The Headlamp Cluster API plugin brings visual clarity, faster debugging, and simplified operations for platform teams, directly inside Headlamp.What this plugin provides
The Cluster API plugin adds a dedicated Cluster API section to Headlamp and brings full visibility into core CAPI resources through consistent list and detail views.
Feature Description Cluster overview View clusters with live control plane and worker replica status. Machine visibility Inspect MachineDeployments, MachineSets, Machines, and MachinePools with status and conditions. Cluster API dashboard Get a centralized view of Cluster API resource health, active condition issues, provider information, and remediation guidance. Control plane monitoring Track KubeadmControlPlane replicas, versions, and associated Machines. Scale from the UI Scale MachineDeployments and MachineSets directly from Headlamp. Owned resource hierarchy Trace relationships between clusters, deployments, sets, and machines. KubeadmConfig inspection View bootstrap configs, files, kubelet args, and join/init settings. Topology awareness Automatically detect and label ClusterClass-managed resources. Map view Visualize Cluster, Control Plane, and Worker relationships. Dynamic API versioning Supports both v1beta1 and v1beta2 Cluster API versions. Prometheus metrics View live metrics from the Headlamp Prometheus plugin inline on Cluster API resource detail pages. A tour of the plugin
The Headlamp Cluster API plugin brings core Cluster API resources into a consistent, visual interface inside Headlamp. Here are some of the key views included in the first release.
Cluster API dashboard
The dashboard provides a centralized view of Cluster API resources and their health across a management cluster.
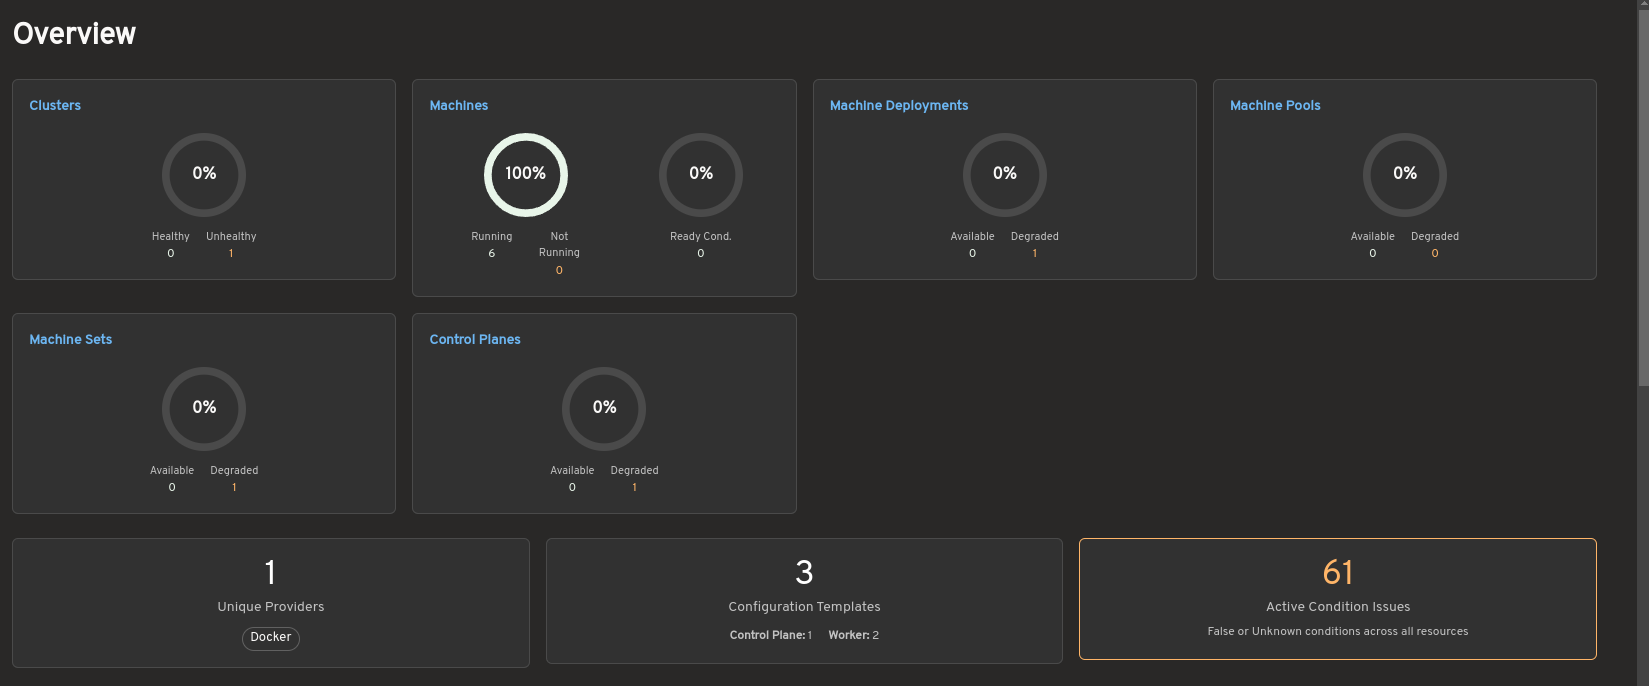
The overview summarizes the status of clusters, Machines, MachineDeployments, MachinePools, MachineSets, and control planes. It also highlights active condition issues, provider information, and configuration template counts to help operators quickly identify degraded or unhealthy resources.
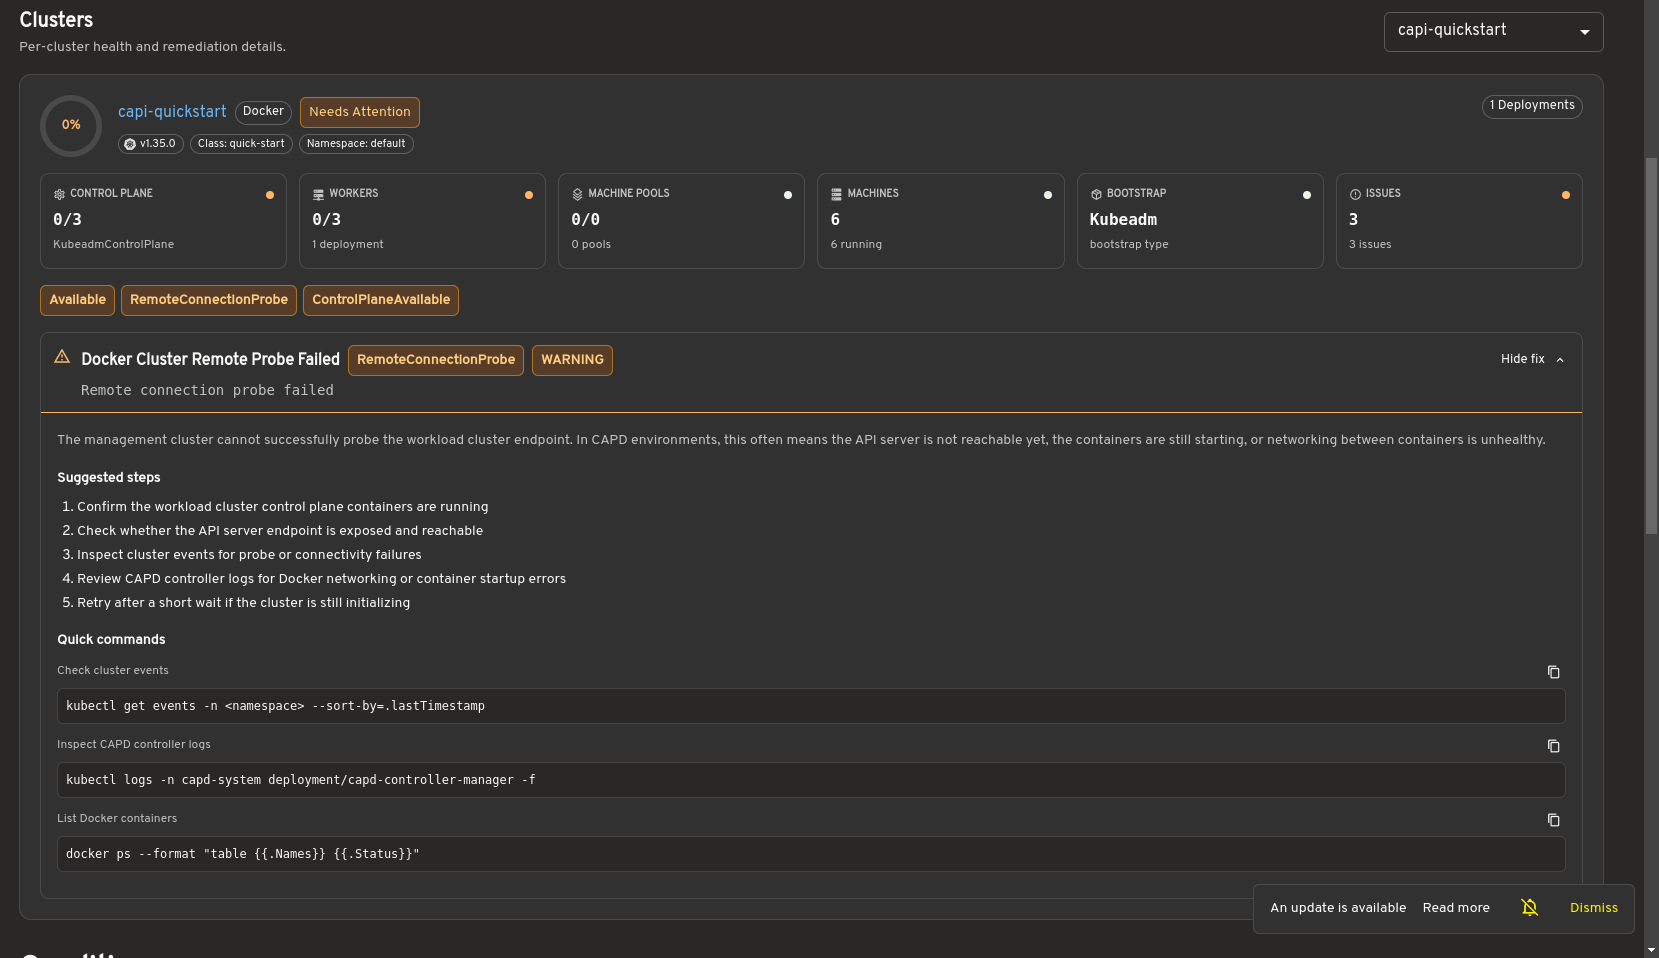
Selecting a cluster opens a detailed health view showing control plane and worker status, machine information, infrastructure details, and resource conditions. When issues are detected, the dashboard provides remediation guidance and diagnostic commands to assist with troubleshooting.
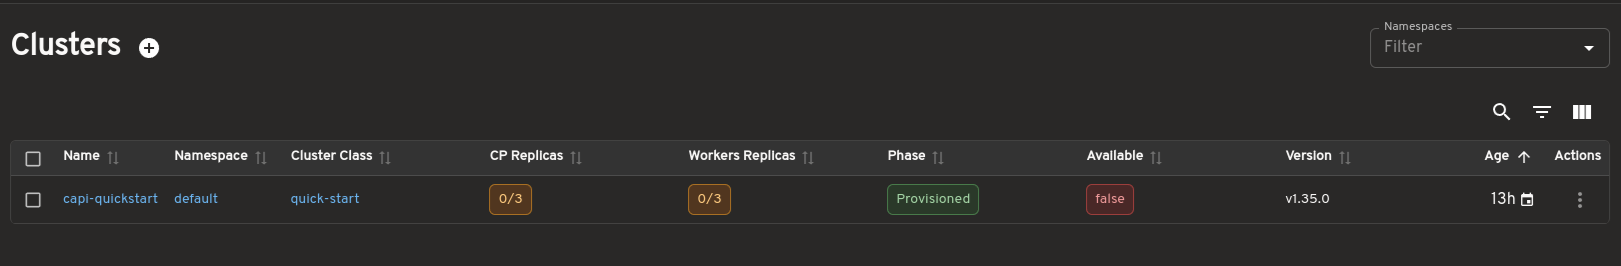
Bring full Cluster API visibility into Headlamp
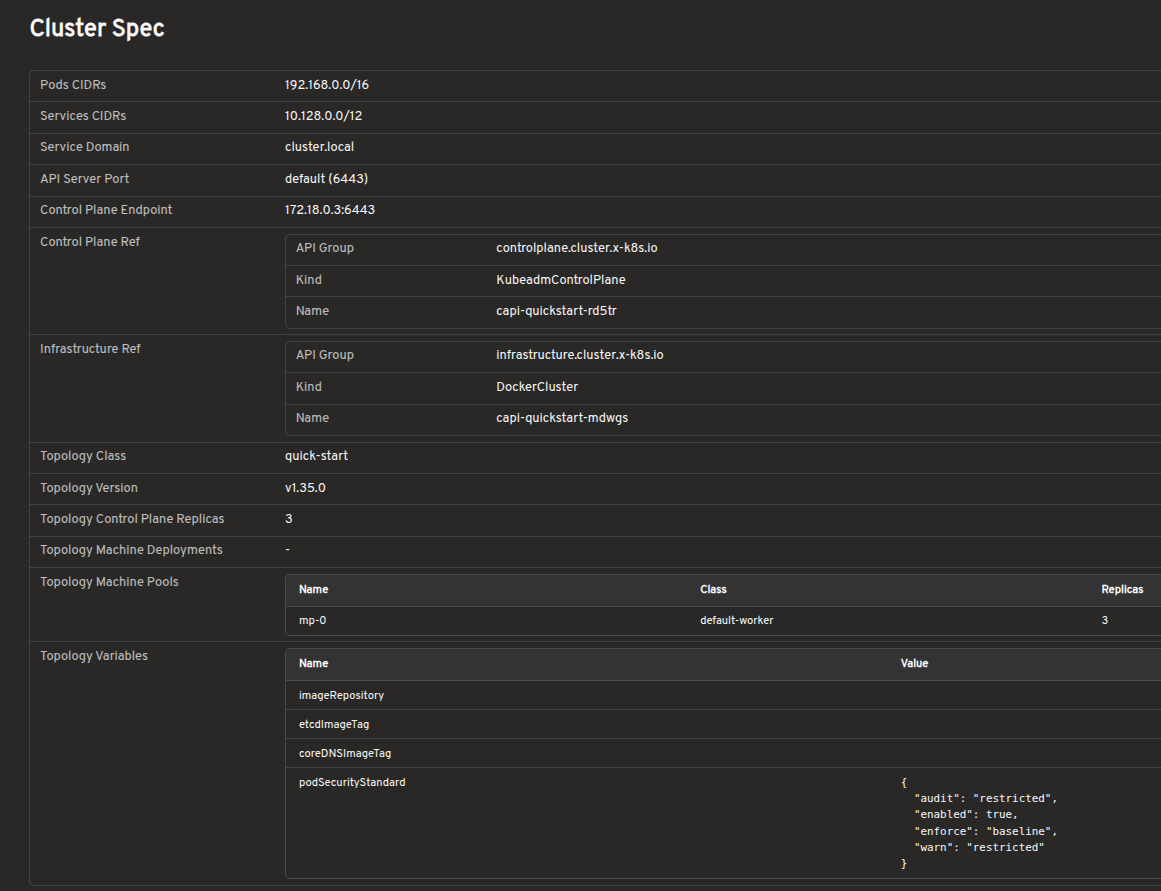
The cluster list view shows all Cluster resources in the management cluster, including control plane and worker replica status. This gives you an at-a-glance understanding of overall cluster health.
The cluster detail view provides resource status, conditions, infrastructure references, control plane references, and related Machines on a single page.
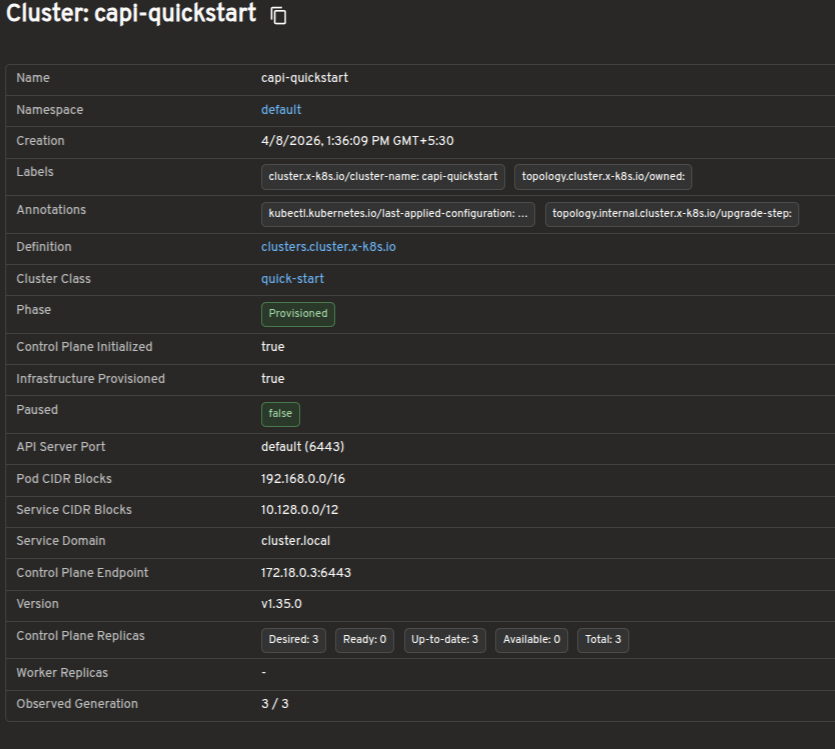
Explore Cluster API resources in a visual interface
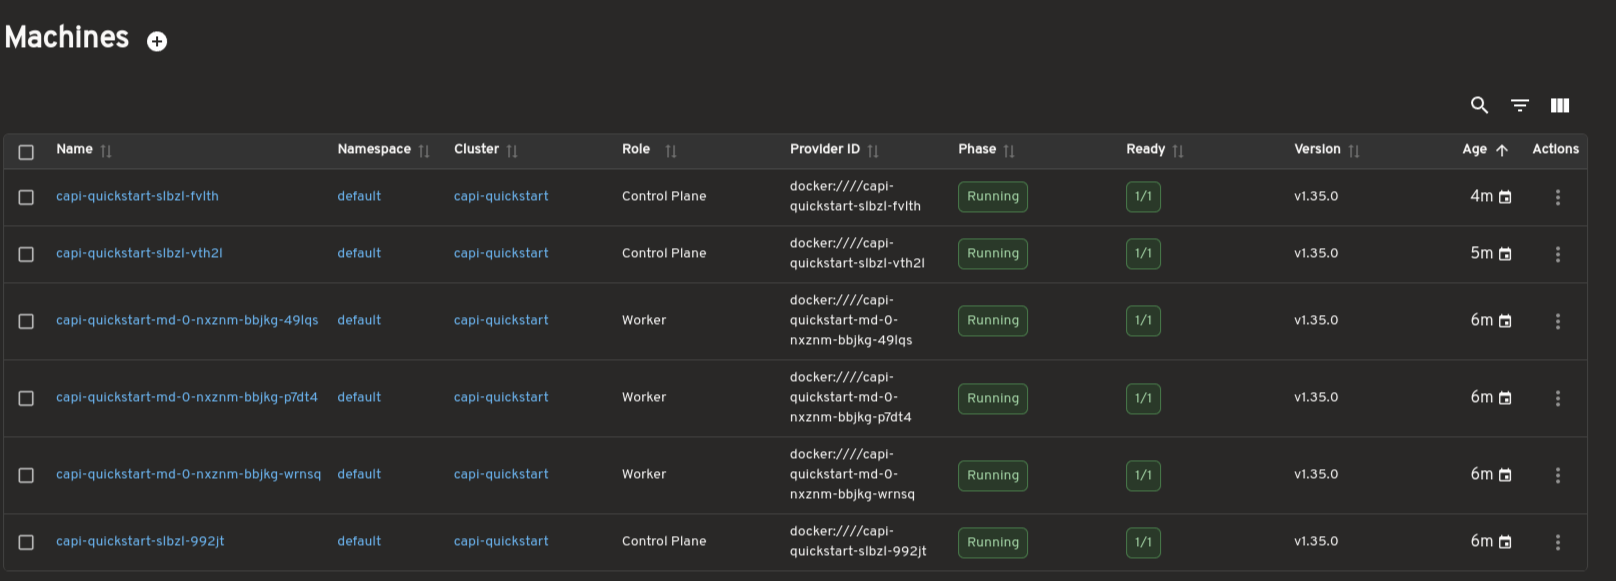
Dedicated views are available for MachineDeployments, MachineSets, Machines, and MachinePools. These pages surface replica counts, ownership relationships, provider IDs, versions, and conditions to support day-to-day operations and debugging.
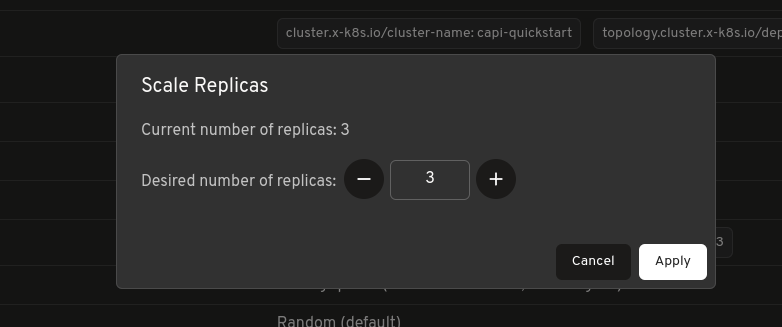
Scale workloads directly from Headlamp
MachineDeployments and MachineSets include a built-in Scale action, allowing you to adjust replica counts directly from Headlamp without using terminal commands.
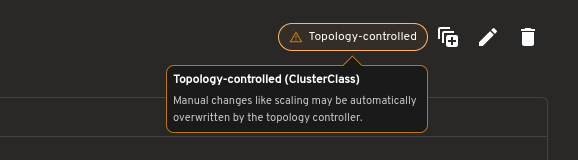
For topology-managed clusters, the plugin also indicates when scaling should be performed at the Cluster level.
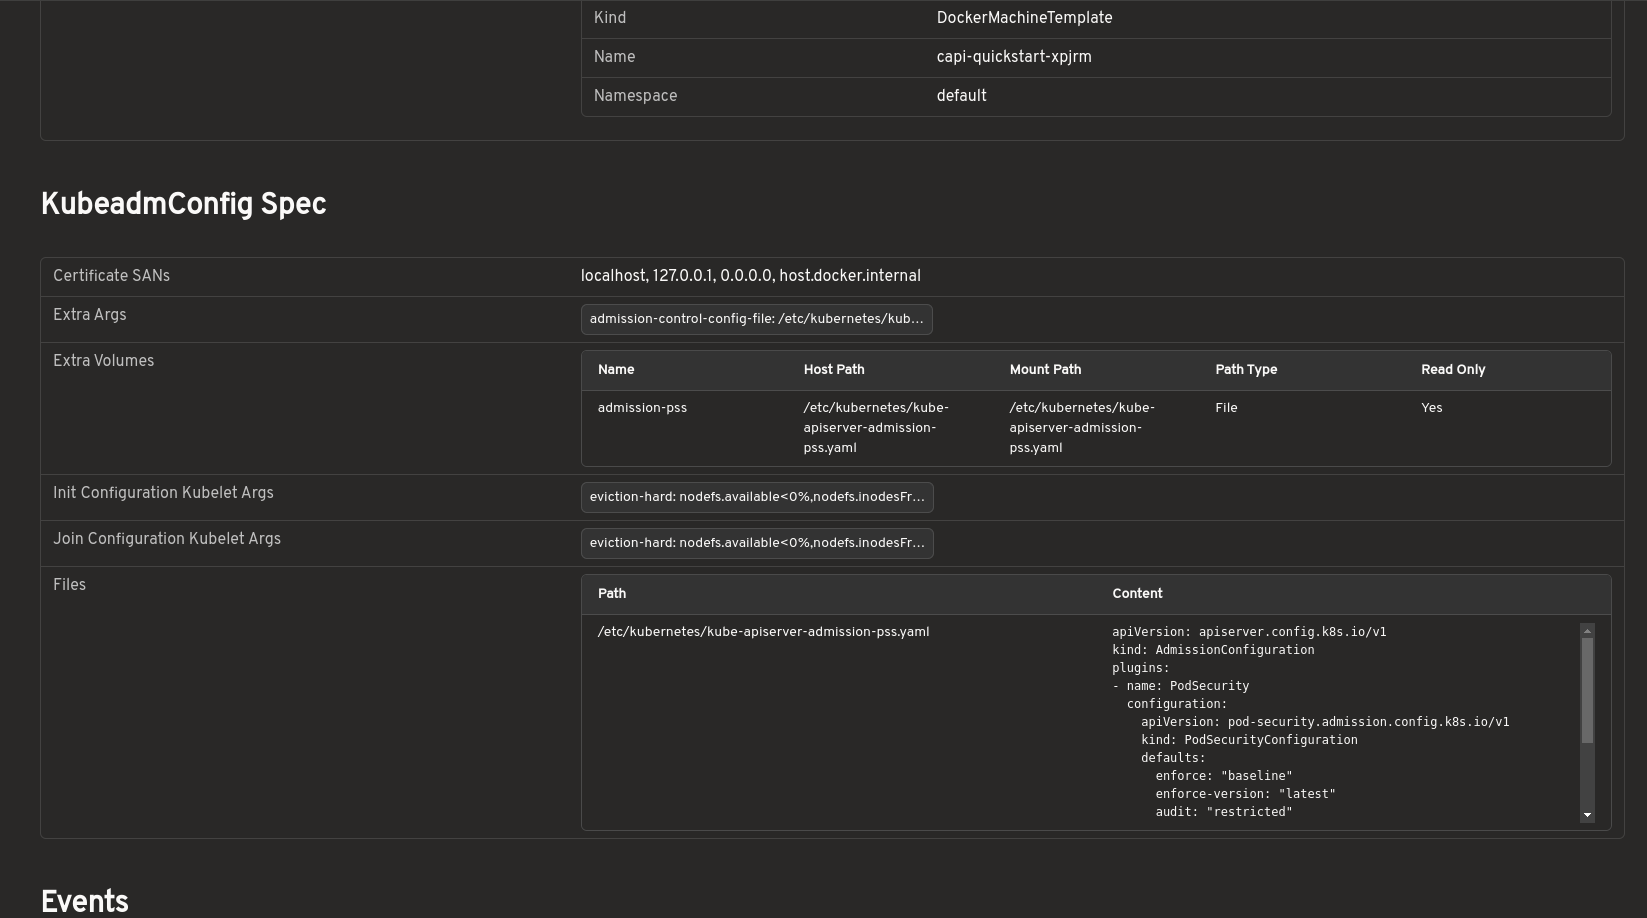
Inspect bootstrap configuration without raw YAML
Bootstrap configurations can be viewed in a structured format, including inline files, kubelet arguments, extra volumes, and join or init settings. This removes the need to inspect raw YAML or secrets manually.
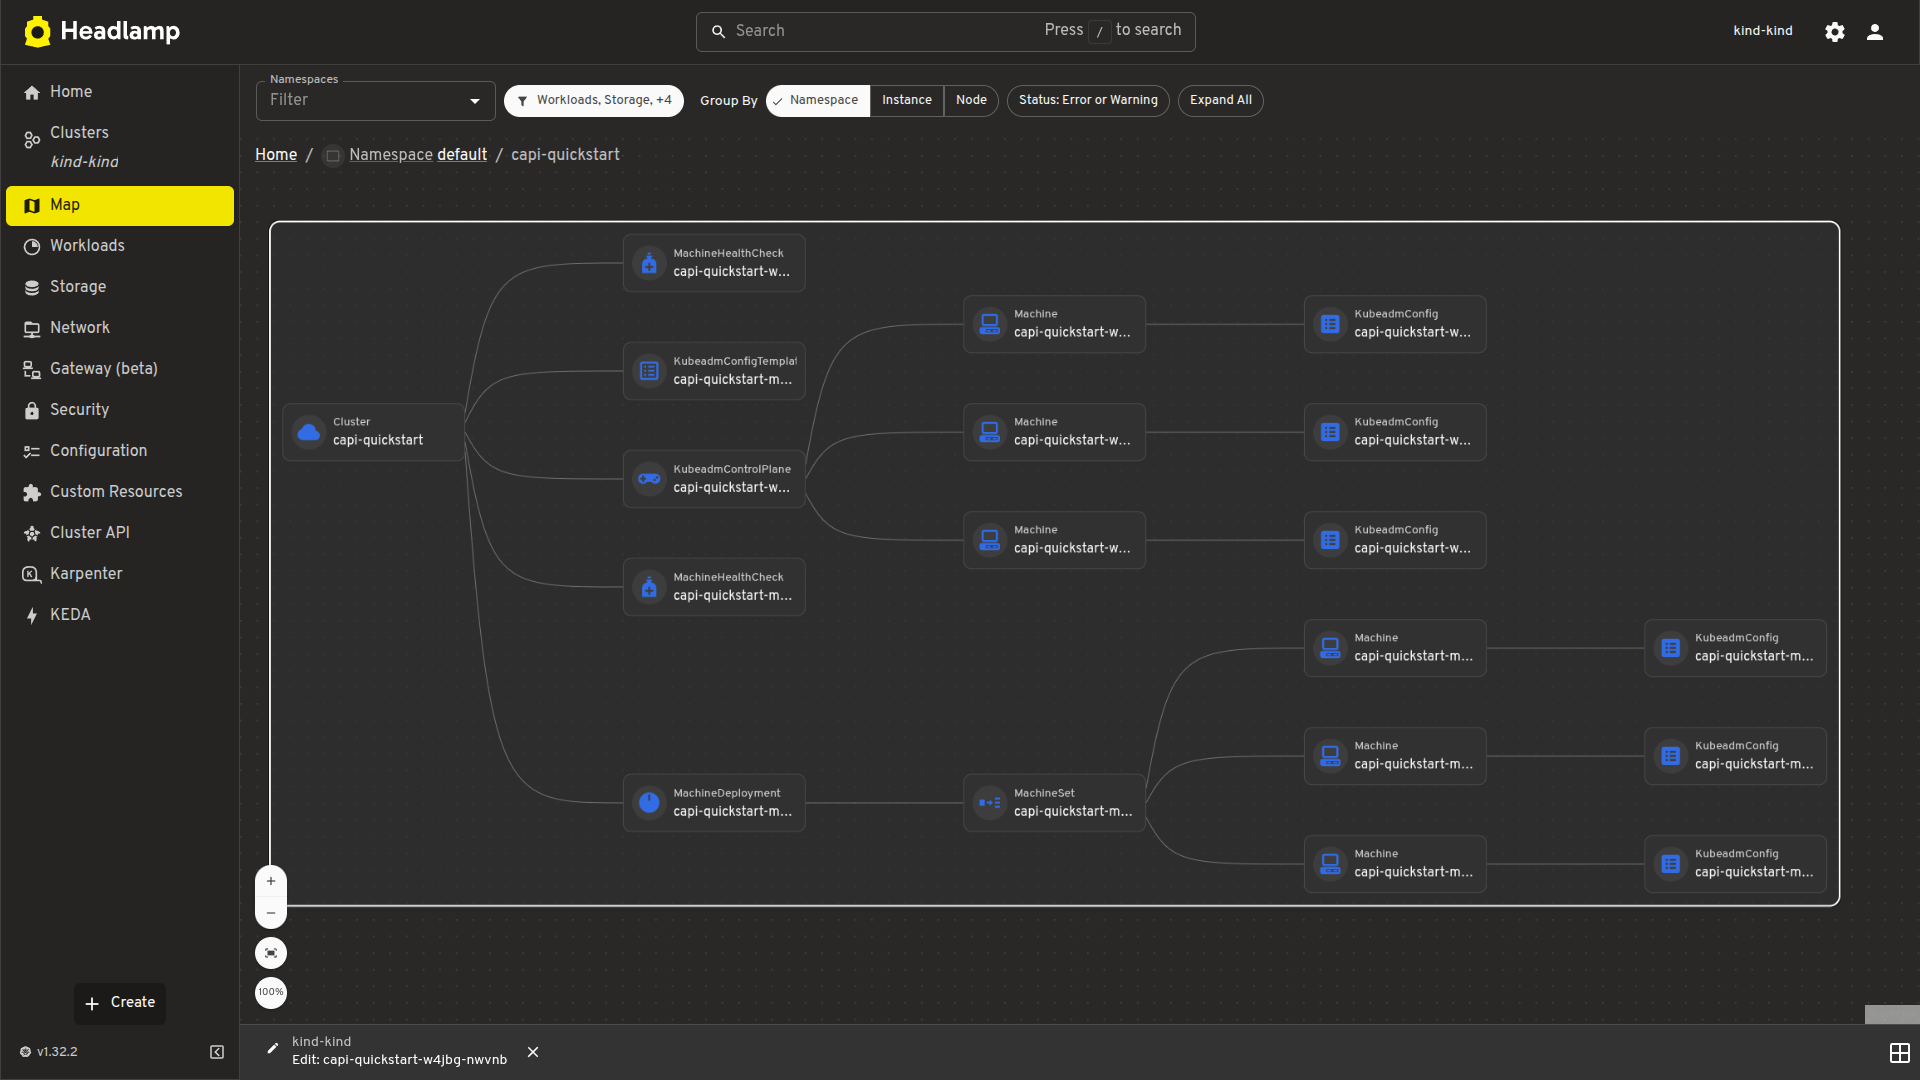
Visualize cluster relationships with map view
A visual map view displays the relationships between Cluster, control plane, and worker resources. It offers a faster way to understand ownership hierarchies and overall cluster structure.
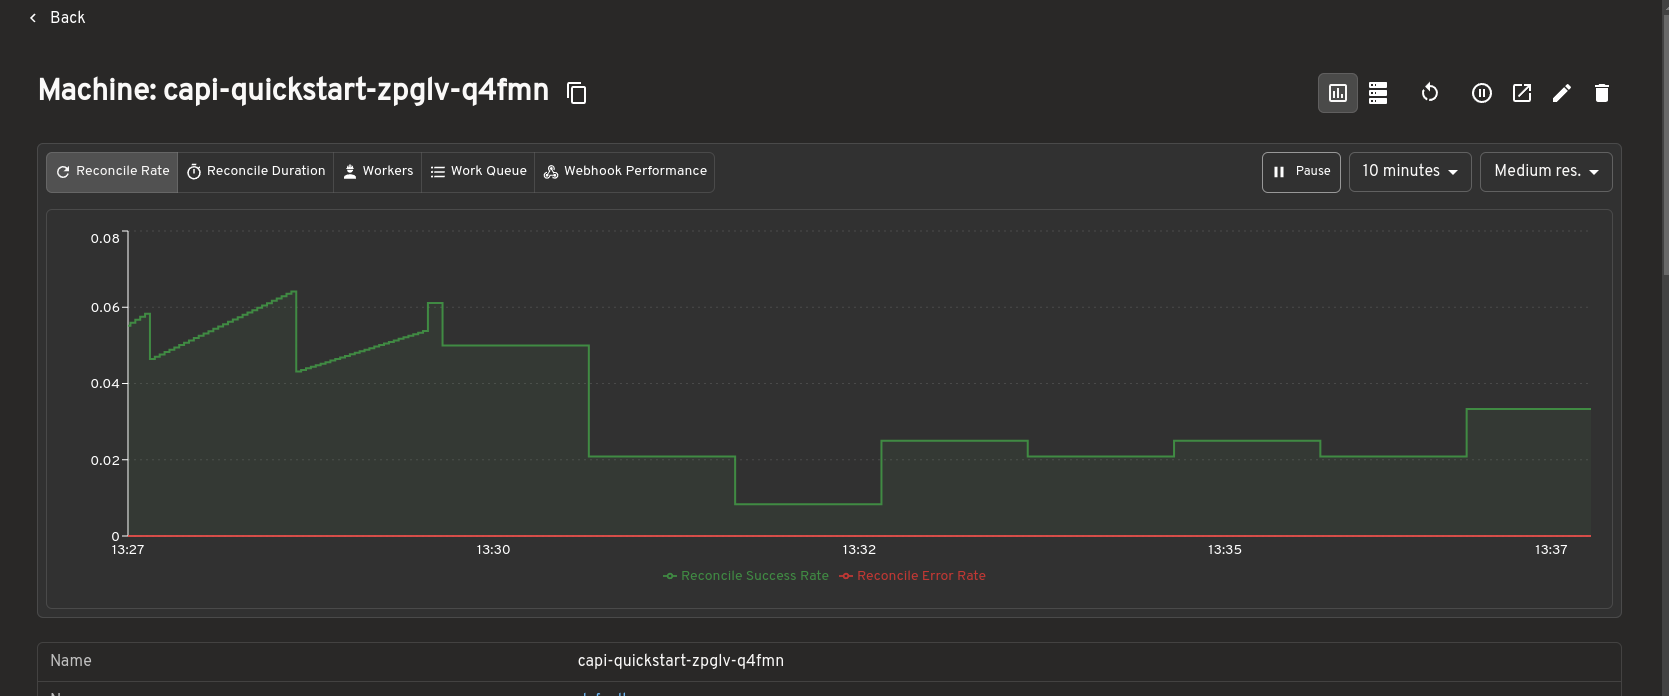
Prometheus metrics integration
The Cluster API plugin integrates with the Headlamp Prometheus plugin to surface metrics directly inside Cluster API resource detail pages.
When the Prometheus plugin is installed and configured, metrics are embedded inline on the detail pages for Clusters, MachineDeployments, MachineSets, and Machines. You can view resource health and performance data alongside status conditions and ownership relationships, without switching to a separate dashboard.
This makes it easier to correlate infrastructure state with live metrics during debugging or day-to-day cluster operations, all from within Headlamp.
How to use
See the
plugins/cluster-api/README.mdfor installation and usage instructions.Developed during LFX Mentorship
This plugin was developed as part of the CNCF LFX Mentorship program under the Headlamp project. The mentorship provided an opportunity to work closely with the Headlamp community while building features to improve the Cluster API management experience.
The focus was not only on implementing features but also on understanding real-world usability challenges around Cluster API operations. Discussions with mentors and community members helped shape the plugin's direction, improve the user experience, and prioritize features most useful to platform teams.
The mentorship also provided valuable experience contributing to large open-source projects: collaborating with maintainers, participating in design discussions, handling release feedback, and iterating on features based on community input.
Work on the plugin is ongoing, with additional improvements and features planned beyond the initial Alpha release.
Feedback and questions
This is an Alpha release, and community feedback directly shapes what comes next.
- Bug reports: Open an issue
- Feature requests: Start a discussion
- Contributing: PRs are welcome
- Kubernetes Slack: Join the #headlamp channel for questions and discussion
-
Inspect Volcano workloads faster with Headlamp
Volcano is a cloud native batch scheduler for Kubernetes, built for high-performance computing, AI/ML, and other batch workloads.
Headlamp is an extensible Kubernetes web UI. With its plugin system, Headlamp can surface APIs and workflows beyond the built-in Kubernetes resources. The Volcano plugin brings core Volcano resources into Headlamp so you can inspect workload state, queue behavior, and gang scheduling details in one place.
Kubernetes was originally designed around long-running services, where applications are expected to start and remain available over time. Batch, AI/ML, and HPC workloads often behave differently: jobs arrive dynamically, compete for limited resources, and may need multiple workers to start together before useful work can begin.
Volcano extends Kubernetes with concepts such as queues, priorities, quotas, and gang scheduling. Instead of treating every Pod independently, Volcano schedules workloads with awareness of the job as a whole and the resources it needs to make progress.
To make these workloads easier to operate and troubleshoot, the Volcano plugin brings that scheduling context directly into Headlamp.
Watch this short walkthrough to see the Volcano plugin in Headlamp:
Visual context helps teams understand Volcano jobs, queues, and PodGroups faster
Working with Volcano often means moving across several related resources while trying to understand a batch workload. You might start with a Job, then look at the related PodGroup, inspect the Pods behind it, check the Queue, and finally return to the Job again. All of that is possible with CLI tools like
kubectland the Volcano CLI, but it can become fragmented very quickly.The Volcano plugin for Headlamp makes that workflow easier by bringing the key resources together in a single UI. Instead of reconstructing relationships manually, you can move directly between Jobs, Queues, PodGroups, Pods, and events from the same interface.
Volcano introduces its own resources on top of core Kubernetes objects:
- Job
- Describes a batch workload as a set of tasks and the Pods they create.
- Queue
- Divides cluster capacity between teams or workloads using quotas and priorities.
- PodGroup
- Ties a group of Pods together so the scheduler can treat them as a single unit for gang scheduling.
The plugin surfaces all three resource types directly in Headlamp, providing dedicated list and detail views for each of them under a Volcano section in the sidebar.
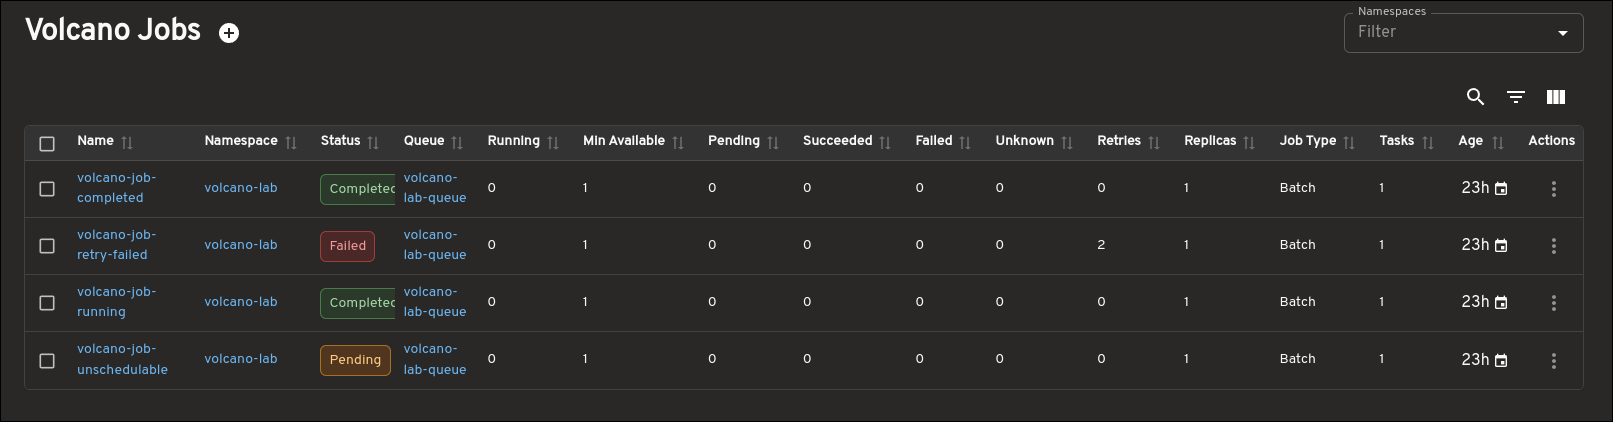
Jobs: workload status, actions, and logs
The Job view is the center of the plugin experience. In the list view, you can quickly understand the basics of a workload, including its status, queue, running versus minimum-available values, task count, and age.
The detail view goes further by surfacing the information you usually need while debugging a Job: task details, Pod status, related Queue and PodGroup links, conditions, events, and more. Instead of forcing you to jump between several CLI commands, the plugin keeps that context together in a single page.
The Job page also adds supported lifecycle actions for appropriate states, including Suspend and Resume, so you can act on a Job directly from the UI.
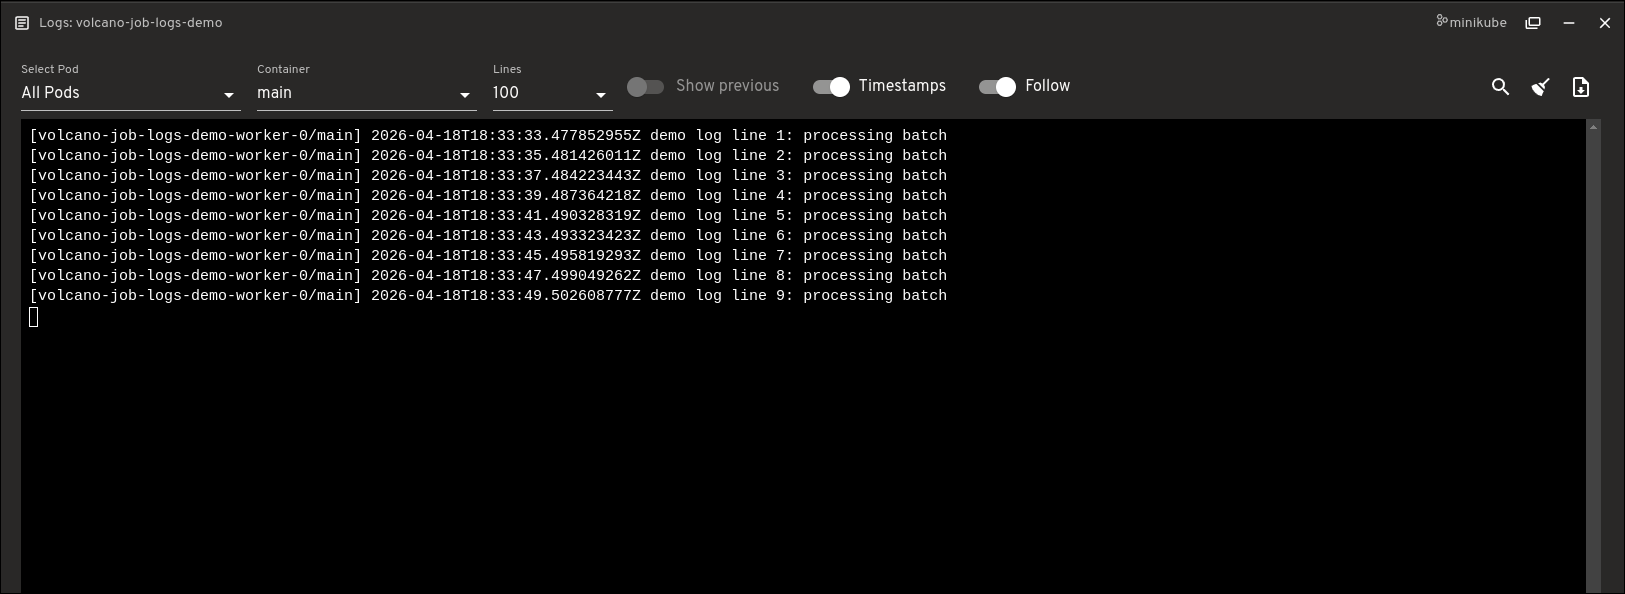
Another useful addition is direct Job logs access. You can open logs for Pods created by a Volcano Job without leaving the Job detail page. The logs viewer supports both single-Pod and all-Pods views, along with container selection and common log controls such as line count, previous logs, timestamps, and follow.
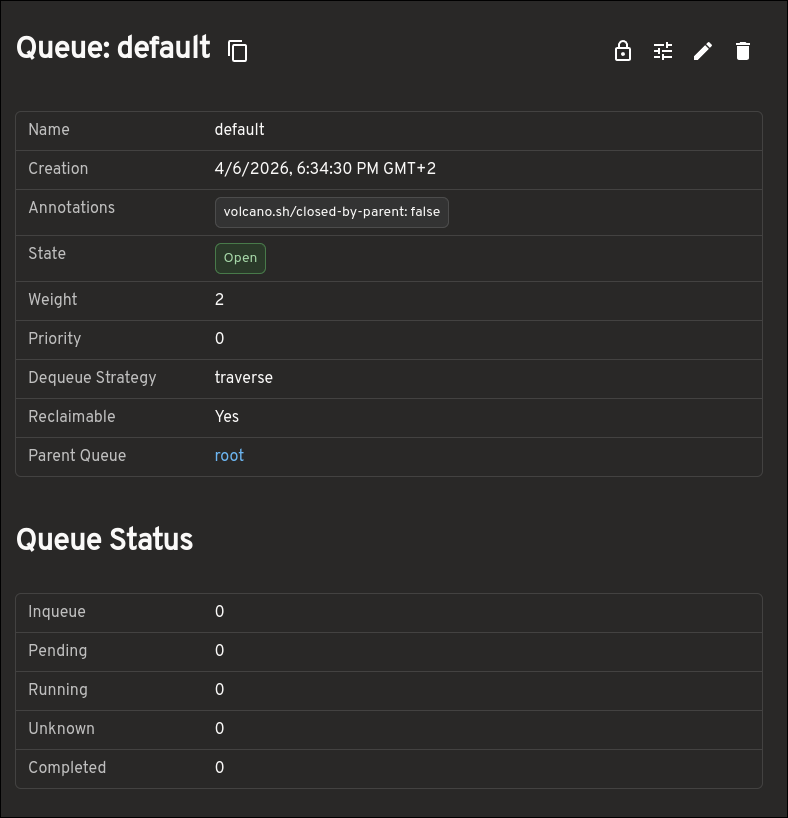
Queues: scheduling capacity and resource context
The Queue view provides much more than a small set of top-level fields. It helps you understand how resources are being allocated and constrained by surfacing capacity, allocated resources, deserved and guaranteed resources, reservation details, child queues, and more.
This makes the Queue page much more useful when trying to understand how resources are being shared and limited across queues.
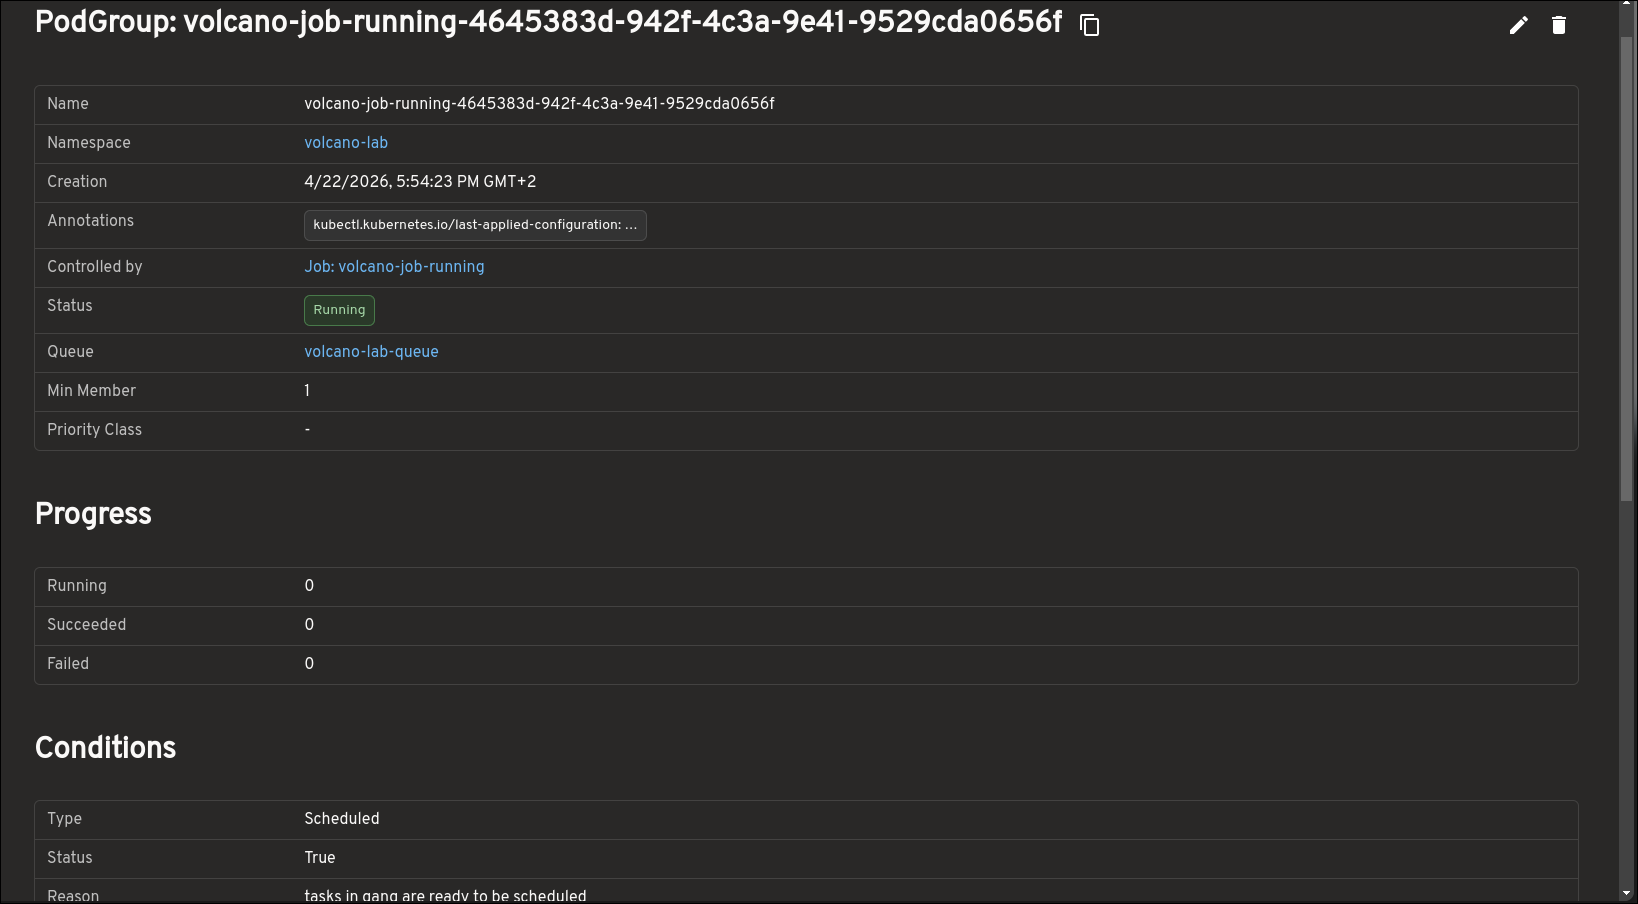
PodGroups: gang scheduling state and blockers
PodGroups are central to understanding gang scheduling in Volcano, and the plugin makes that state easier to inspect. The PodGroup view highlights progress, conditions, minimum resource requirements, and more.
This also gives you a clearer picture of whether a workload is blocked because it has not yet met the scheduling conditions required to run as a group.
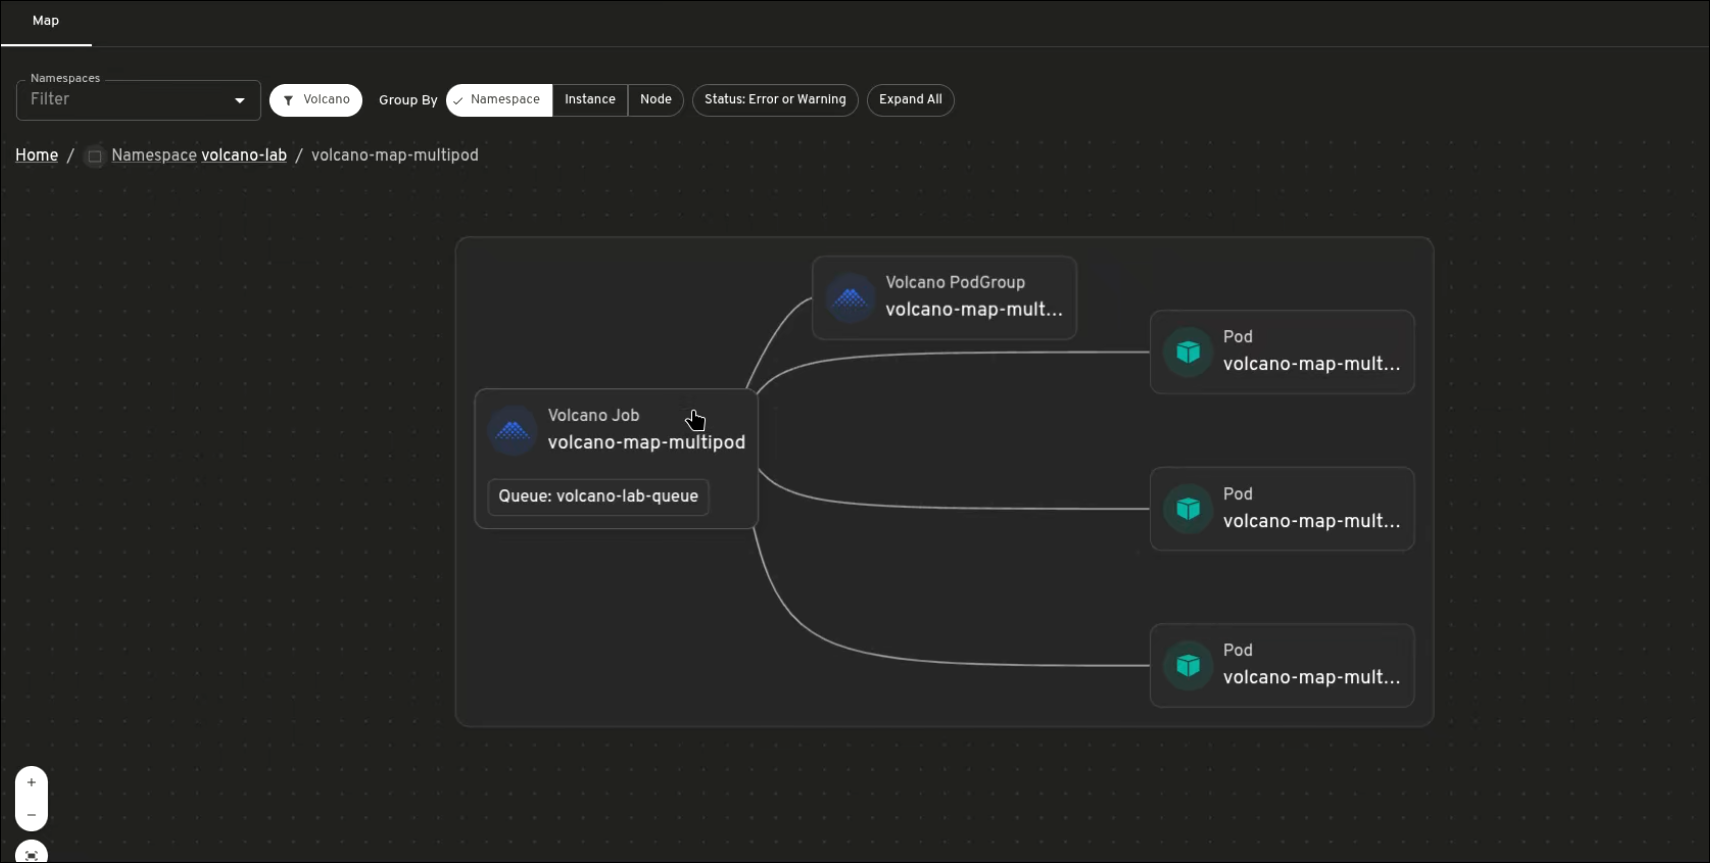
Map view: jobs, queues, PodGroups, and pods in one place
The map view shows how Volcano resources are connected. Instead of inspecting each resource separately, you can see how Jobs, PodGroups, Queues, and Pods relate to one another.
This is especially useful when a workload is pending or not progressing as expected. The map can show the Job, its related PodGroup, the Pods created for the workload, and the Queue context around it. Warning and error states also make it easier to spot resources that need attention.
Why use this alongside CLI tools
The plugin is not trying to replace
kubectlor the Volcano CLI. Those remain important for automation, scripting, and raw object inspection. What the plugin improves is the interactive troubleshooting experience: discovering related resources more quickly, understanding structured detail pages, and moving from scheduling state to runtime output without switching tools constantly.What’s next
This work brings the main Volcano workflow into Headlamp, including Jobs, Queues, PodGroups, and the map view. Possible future work includes Prometheus integration, richer scheduling insights, and more workflow-oriented visibility across Volcano workloads.
Try it and share feedback
To try the plugin:
- Install Headlamp.
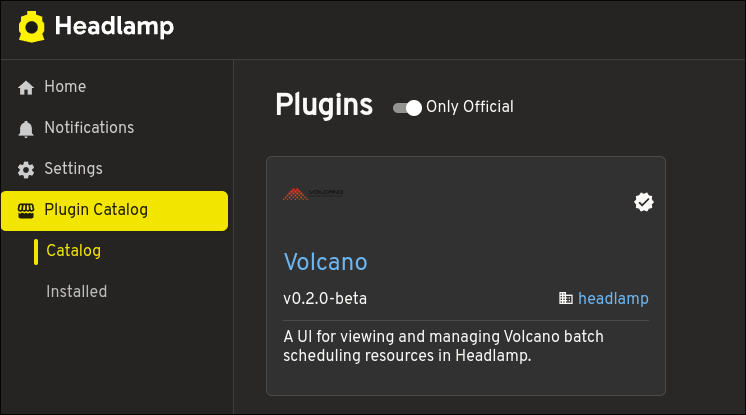
- Open the Plugin Catalog from the Headlamp UI.
- Search for Volcano.
- Install the Volcano plugin.
- Connect Headlamp to a Kubernetes cluster where Volcano is already installed.
If you have ideas, feature requests, or bug reports, open an issue in the Headlamp plugins repository. Feedback from real Volcano users will help shape what comes next.
-
See your serverless: introducing the Headlamp plugin for Knative
Headlamp is an open-source, extensible Kubernetes SIG UI project designed to let you explore, manage, and debug cluster resources.
Knative brings serverless workloads to Kubernetes, handling traffic routing, autoscaling, and revision management so teams can deploy and iterate without fighting infrastructure. But operating Knative workloads day-to-day can be difficult, there's still a lot of jumping between the
knCLI,kubectl, and the Kubernetes UI to get a full picture of what's running.We built the Headlamp Knative plugin to bridge that very gap, allowing operators to inspect, understand and act on their workloads all from a single place. This plugin was built as part of the LFX mentorship. Here's a tour of what we shipped.
Here is a short walkthrough of the Knative plugin for Headlamp:
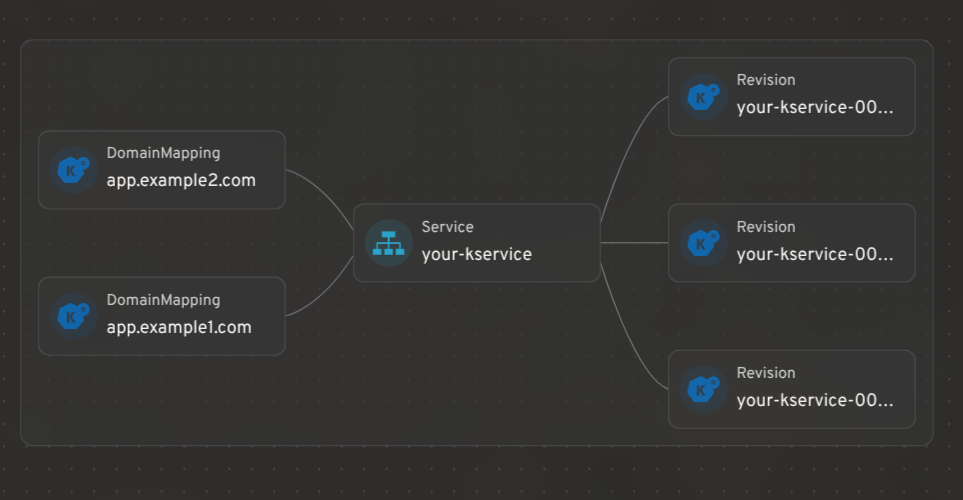
Integrating Knative resources with Headlamp's map view
Headlamp's resource mapping works for Knative CRDs too. You can see how KServices, Revisions, and DomainMappings relate to each other in a single graph view.
KService management: edit traffic splits, restart pods, and view logs
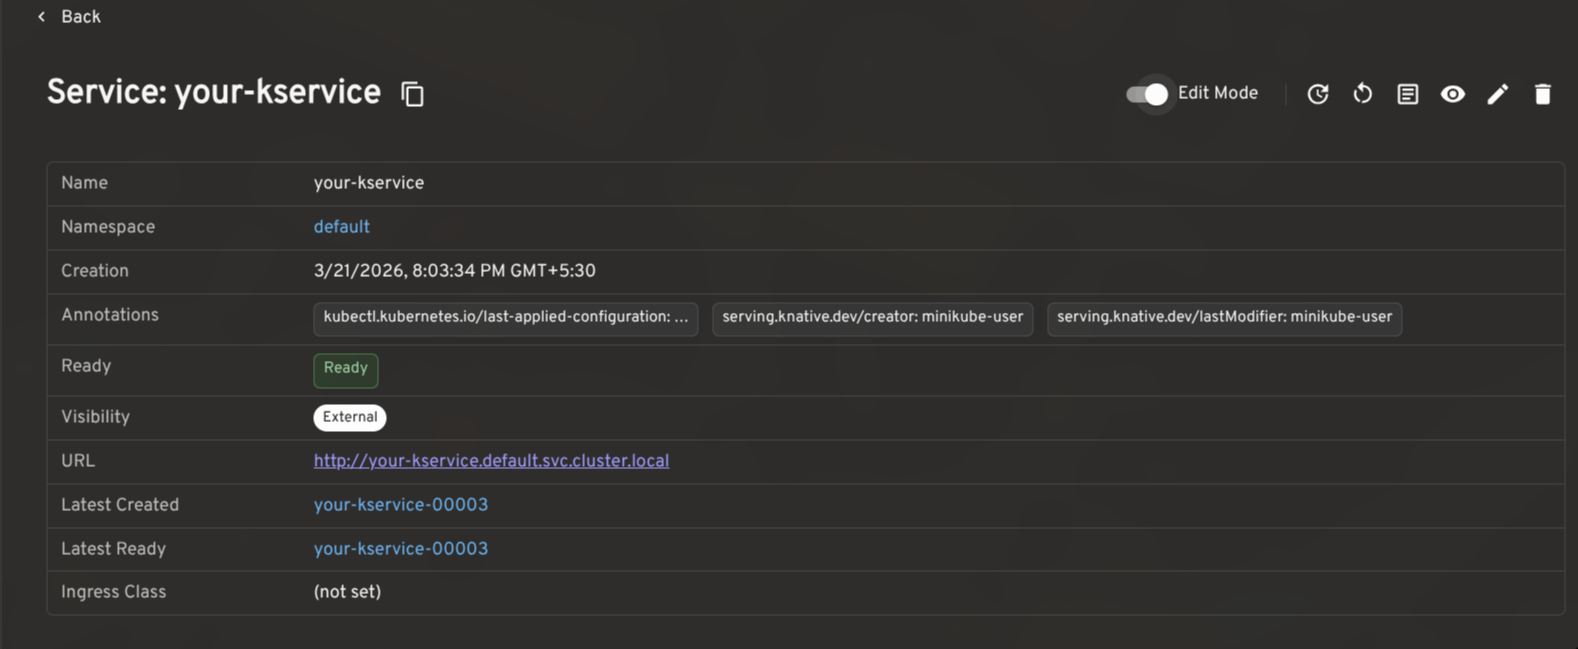
A KService is the top-level resource in Knative: it manages the lifecycle of Routes, Configurations, Revisions, and everything needed to run and expose your application.
The plugin gives KServices a full detail view with an Edit Mode toggle for making live changes to traffic splits, autoscaling annotations, and more. Common actions like viewing the YAML, opening logs, triggering a redeploy, or restarting backing pods are surfaced in the header, gated by your current RBAC permissions.
Traffic splitting: route across revisions for gradual rollouts and testing
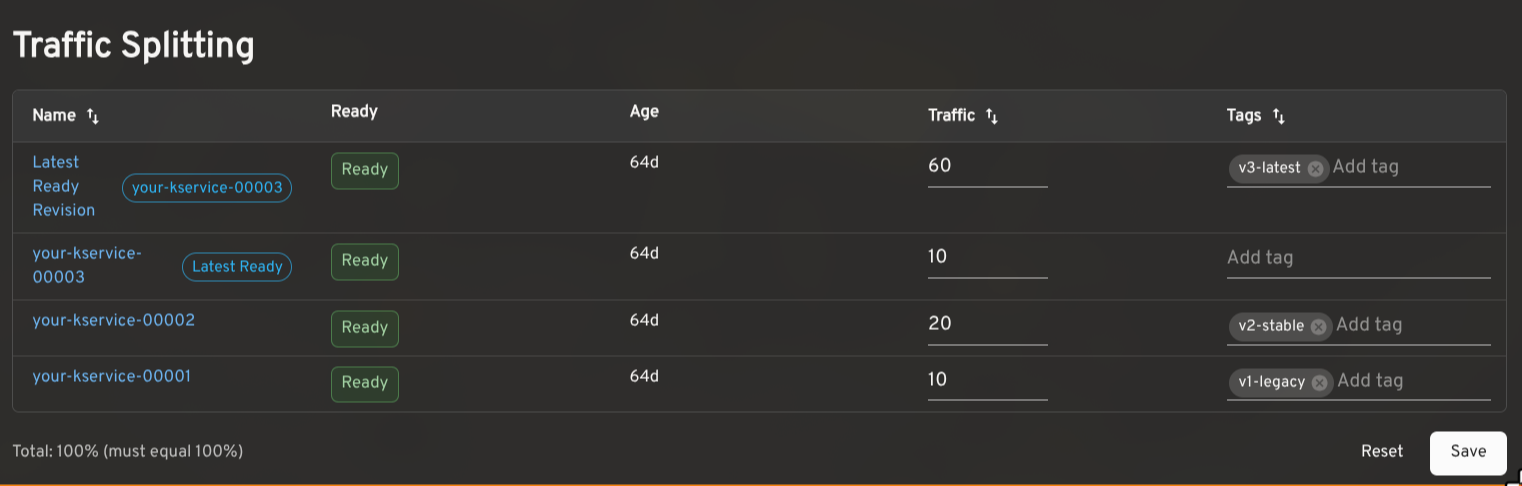
Knative makes it possible to route traffic across multiple Revisions of the same service. This is useful for canary releases, gradual rollouts, tagged preview URLs, and A/B testing.
The plugin shows the traffic assigned to each Revision, the latest ready Revision, readiness status, age, and configured tags. In edit mode, you can adjust percentages and tags inline. The plugin validates that traffic sums to 100% and that tags are unique before saving. Tagged routes with a reported URL render as clickable links.
Autoscaling configuration: view effective settings and cluster defaults
Knative's autoscaler supports a range of settings: concurrency targets, target utilization, RPS targets, min/max scale, initial scale, stable window, scale-down delay, and more. The effective value for any workload is a combination of KService-level annotations and cluster-wide ConfigMaps.
The plugin reads
config-autoscalerandconfig-defaultsand shows the effective configuration per KService in context, so you can see at a glance whether a setting is explicitly configured or falling back to the cluster default.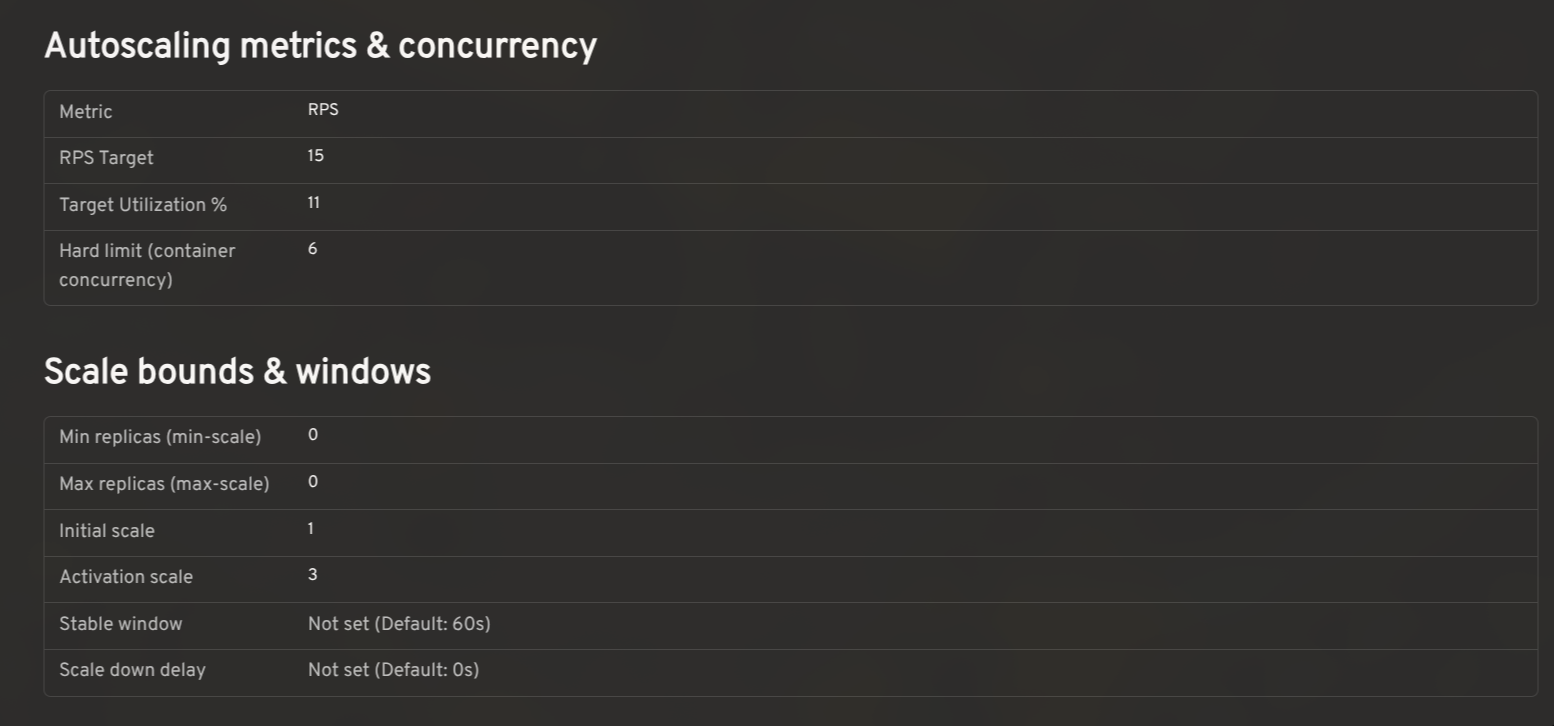
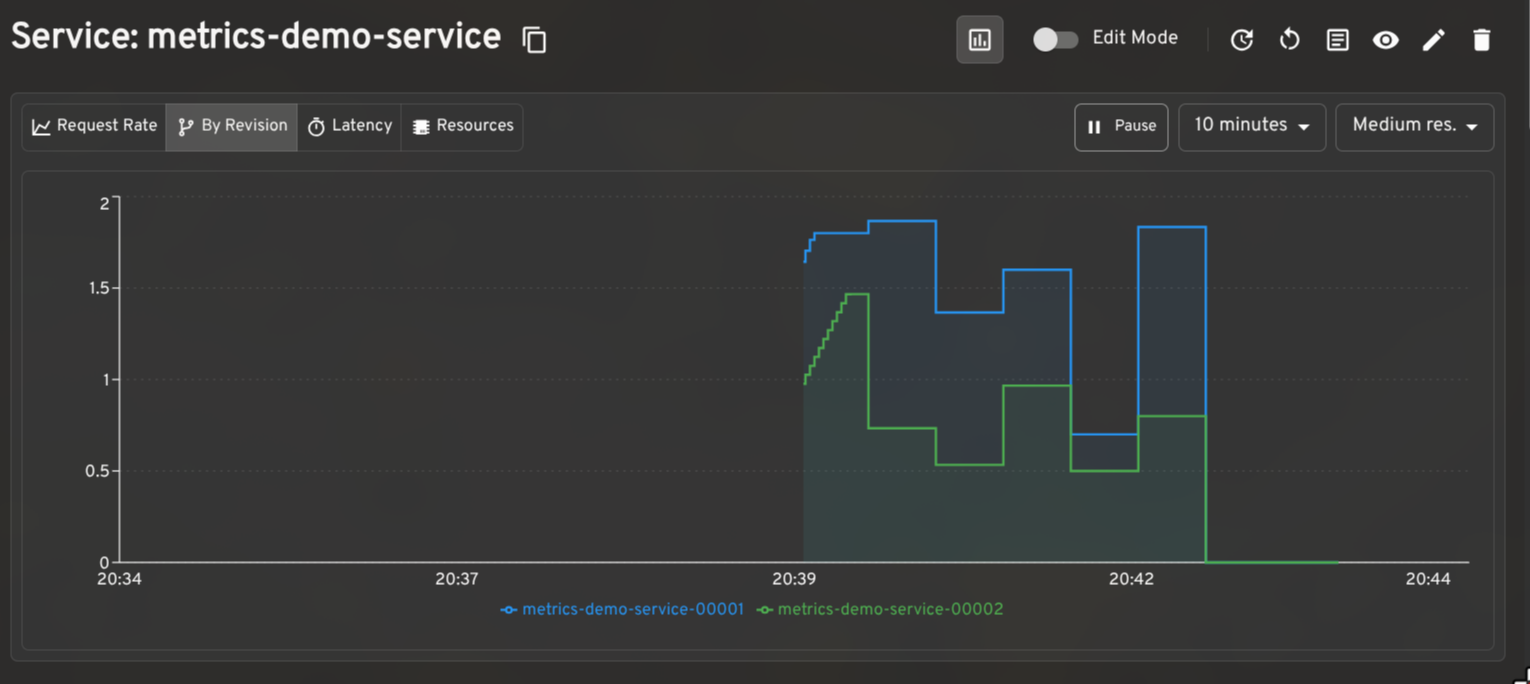
Prometheus metrics: monitor request rates, latency, and resource utilization
When paired with the Prometheus plugin for Headlamp, the plugin renders request rate, latency, and resource utilization graphs on KService and Revision detail pages. The per-revision request rate breakdown is particularly useful when validating a traffic split in progress.
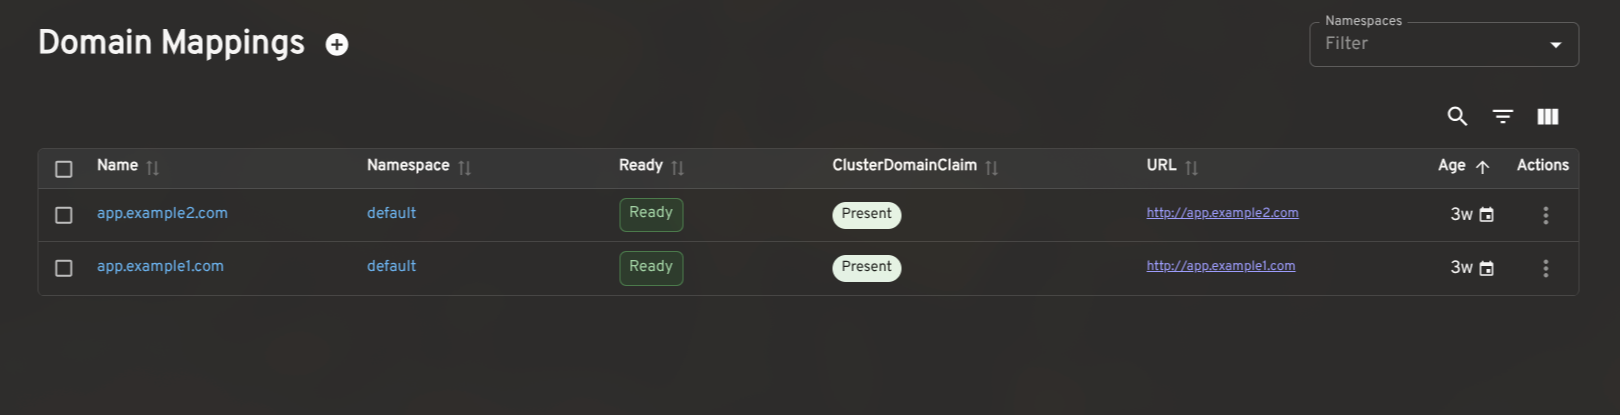
Dashboard for other CRDs
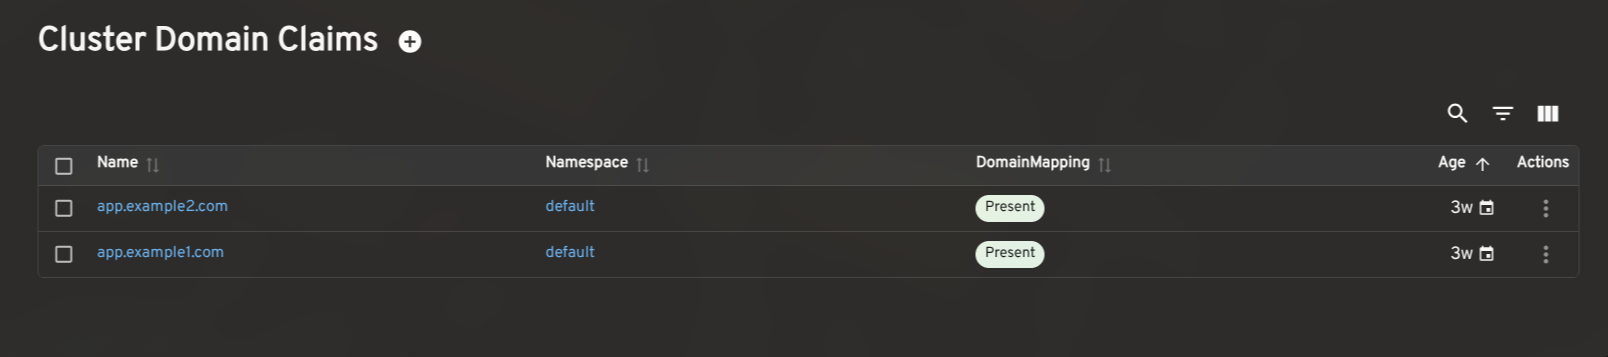
The plugin also includes list and detail views for Revisions, DomainMappings, ClusterDomainClaims, and a cluster-level Networking overview (reading
config-networkandconfig-gatewayto surface the effective ingress class, gateway settings, and backing services). These give operators a complete picture of Knative's state without leaving Headlamp.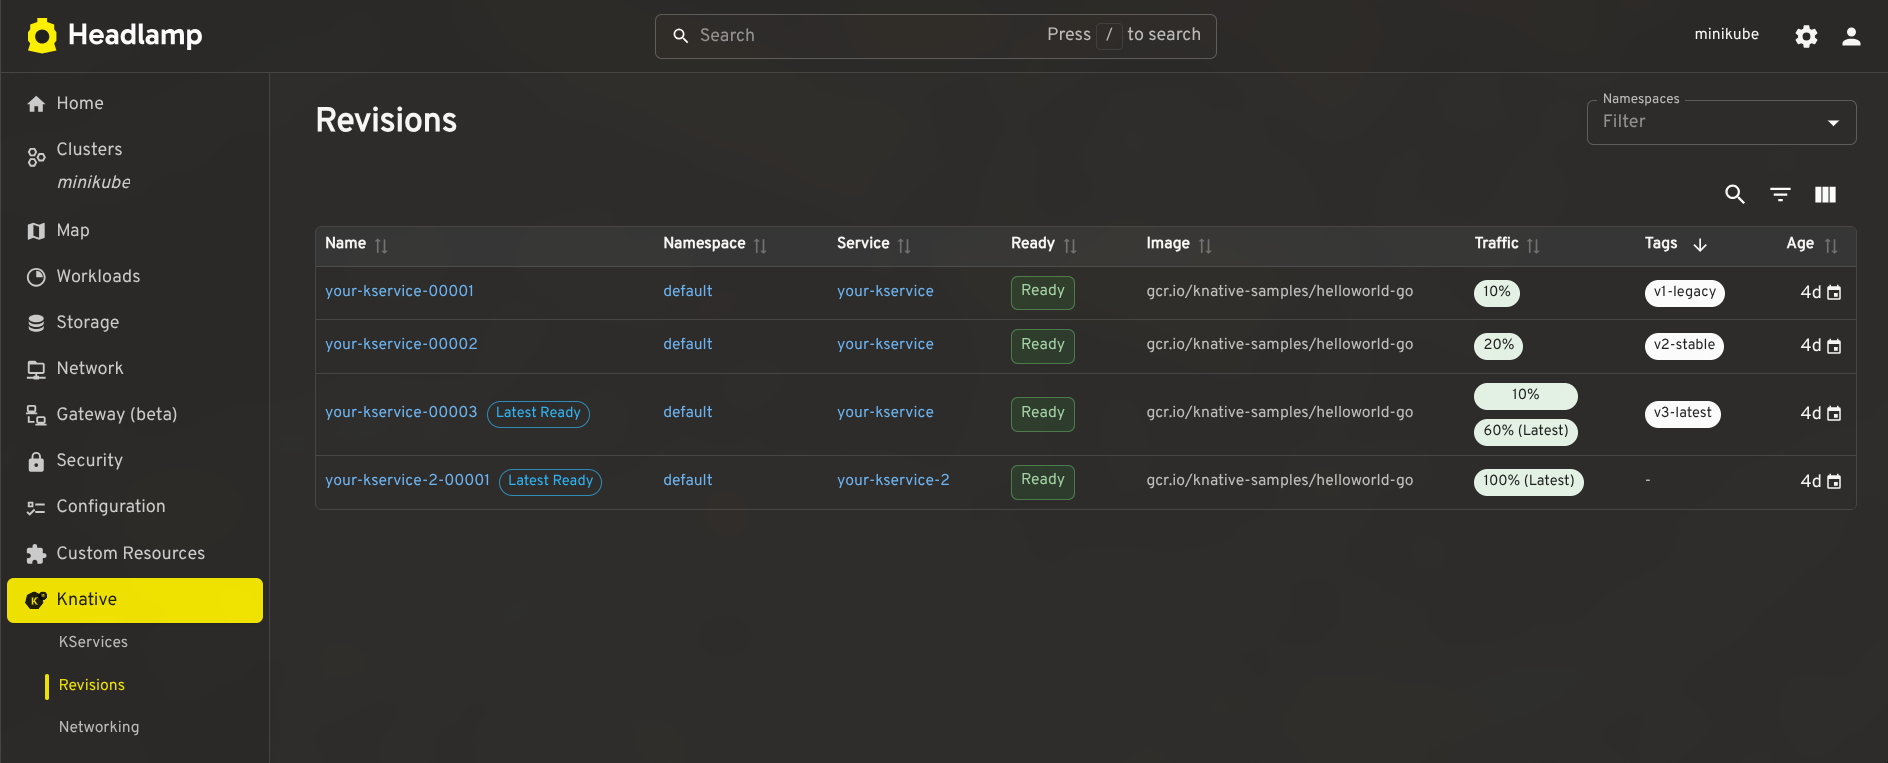
How to install the Knative plugin in Headlamp
- Make sure Knative is installed in your cluster.
- In Headlamp Desktop, open the Plugin Catalog, search for Knative, and click Install.
- Reload Headlamp, a new Knative entry will appear in the sidebar.
For development or source-level setup, see the Knative plugin README. The current release is 0.3.0-beta.
Share your feedback
We'd love feedback from Knative operators and users. If you hit a bug or want support for a workflow we haven't covered, please open an issue. You can also find us in the Kubernetes Slack #headlamp channel.
-
Spotlight on WG Device Management
The rising popularity of AI, Edge, and Telecommunications workloads on Kubernetes has led to new requirements for hardware management. We now need hardware specification beyond CPU time and memory allocations. This includes allocating GPUs, TPUs, network interfaces, and other hardware, sometimes after pod start and occasionally through time-sharing.
Efficiently managing this specialized hardware is the mission of the Device Management Working Group. Their cornerstone project, Dynamic Resource Allocation (DRA), recently graduated to GA, marking a fundamental shift in how the project handles hardware-intensive workloads at scale.
In this spotlight, we sit down with working group chairs Kevin Klues, Patrick Ohly, and John Belamaric to discuss the limitations of the legacy device model, the NP-hard challenges of scheduling, and how they’re building a more programmable, hardware-aware future for Kubernetes.
Introducing Device Management
Natalie Fisher: Can you introduce yourself, your role, and how you got involved in the Device Management Working Group?
Kevin Klues: My name is Kevin Klues. I am a Distinguished Engineer at NVIDIA. I have been a co-chair of the device management working group since its inception at Kubecon EU 2024. I have also been involved with DRA (the working group's primary deliverable) since its inception in 2019 / 2020. I have also been a kubelet maintainer since 2019, with a focus on its device manager, CPU manager, and topology manager subcomponents. The challenges we saw with using these components for workloads that relied on external accelerators (e.g., GPUs) are what triggered us to start working on DRA in the first place.
Patrick Ohly: I am a Principal Engineer at Intel. In Kubernetes, I am a Tech Lead for SIG Testing and SIG Instrumentation and co-chair of the Device Management WG. I was co-chair of the WG Structured Logging and a member of the Steering Committee. Some of my early contributions to Kubernetes include ephemeral CSI volumes and storage capacity tracking, so I had some experience with API design, implementation, and scheduling. We knew that introducing a major new API for accelerators would be hard. Somewhat foolishly, I accepted that challenge in 2020, wrote the initial DRA KEP (now known as “classic DRA”) and implemented most of it, then started over with a second KEP for today’s "structured parameters DRA". Initially, it was an uphill battle to convince maintainers that this work was necessary. It was only around 2023 that interest in DRA picked up, leading to the formation of the working group.
John Belamaric: I am a Senior Staff SWE at Google, and the third co-chair of WG Device Management, also since its inception. I am also a co-chair of SIG Architecture since 2019. As Patrick mentioned, in late 2023, interest in DRA really picked up. The initial implementation, made autoscaling very challenging, and so there was some concern in the community about advancing it to beta. I got involved to try to help address some of those concerns, and the three of us, along with Tim Hockin, worked hard over the next few months to build a consensus around a new design. To facilitate this collaboration, we formed the working group after discussion at KubeCon in Paris in 2024.
The problem and the solution
The working group emerged from a fundamental rethink of how Kubernetes interacts with specialized hardware. At the heart of this evolution is Dynamic Resource Allocation (DRA). Rather than treating devices as simple integers, DRA provides a structured framework that breaks device management into four distinct stages:
- Modeling: Vendors use the ResourceSlice API to advertise the granular capabilities and capacity of their hardware.
- Requesting: Users define their specific hardware needs—such as GPU memory or interconnect requirements—through the
ResourceClaimAPI. - Scheduling: The Kubernetes scheduler uses these APIs to match workload requirements against available hardware intelligently.
- Actuation: Once a match is made, the system handles the "handshake" that prepares and secures the device for the Pod's use.
NF: For readers who may not be familiar, what is the Device Management Working Group, and what problems is it trying to solve?
KK: The Device Management Working Group was chartered to enable simple and efficient configuration, sharing, and allocation of accelerators and other specialized hardware across Kubernetes workloads. Think GPUs, TPUs, FPGAs, and similar devices that don't fit neatly into Kubernetes' traditional resource model.
The problem we set out to solve is that the legacy Device Plugin API (which has been the primary mechanism for exposing hardware accelerators in Kubernetes) is fundamentally limited. It treats devices as opaque integers: you can request "2 GPUs," but you can't say anything meaningful about which GPUs you need, how they should be connected to each other, whether they can be shared, or how they should be partitioned. That was fine for simple cases, but modern AI/ML workloads are anything but simple. They span multiple nodes, require specific interconnect topologies, and increasingly need to share or partition hardware dynamically.
The working group's primary deliverable is Dynamic Resource Allocation (DRA), a new framework that replaces the rigid device plugin model with a flexible, declarative API. With DRA, workloads can describe their hardware requirements (e.g., GPU type, memory capacity, interconnect topology, desired partitioning) and drivers can publish fine-grained device attributes that the scheduler can act on. DRA graduated to GA in Kubernetes 1.34, and the ecosystem around it (e.g., drivers, tooling, and new API extensions) is growing rapidly.
PO: As Kevin said, the working group was formed around the existing effort to develop DRA. The initial work was done with only a handful of people actively involved, and perhaps also could only be done successfully in such a setup. But because it touches on so many different areas of Kubernetes, we also needed a place to discuss that and get the broader community of Kubernetes maintainers, device vendors, and, to a lesser extent, also end-users involved. The working group provides that place, with regular meetings online (one slot for Americas/EMEA, one for EMEA/Asia) and at KubeCon.
JB: DRA is the first problem the WG has addressed. It is focused on selection, allocation, and configuration of the devices. We broke the problem down into four parts: how does the vendor model the device and advertise capacity, how does the user request it, how do we schedule that request on top of the advertised capacity, and how do we actuate that result (that is, how do we make the device ready and available to the Pod).
One thing that is fundamental to the approach we took is an awareness of the incredible diversity of hardware and the rapid rate of change in the hardware industry. We knew that we couldn’t keep up with the change if the Kubernetes APIs had to change for every type of hardware. Instead, we created a general approach where we address the hardware aspects that are important to Kubernetes. What we have done so far is focus on the scheduling and configuration aspects of devices. We build a device modeling API (the ResourceSlice API) that vendors use to model the scheduling characteristics of their devices, and allow users to pass through arbitrary configurations to those devices. By doing this, Kubernetes can be “programmed” to understand these aspects of the devices, without needing to be modified.
But DRA, as it stands right now, is very focused on scheduling. There are other aspects of Device Management that are in scope for the WG. In particular, we are looking into device failure detection and mitigation, and whether there is some better support we can build into Kubernetes to help.
Also, as Kevin alluded to, devices are often allocated and used in groups, rather than individually. Choosing the right devices to work together in a group depends on how they are interconnected; for example, NVIDIA GPUs may be in an any-to-any fabric arrangement in an NVLINK domain, whereas TPUs may have a 3D torus interconnect. This affects the “selection, allocation and configuration” of devices, and we have a lot more work to do to address these use cases.
A cross-SIG effort
Because device management touches scheduling, node operations, autoscaling, networking, and API design, the work naturally spans multiple SIGs across the Kubernetes project.
NF: How does collaboration across these SIGs work in practice, and why is it necessary?
KK: Device management touches nearly every layer of the Kubernetes stack, which is why the working group was chartered as a cross-SIG effort from the start. We have five stakeholder SIGs: sig-node, sig-scheduling, sig-autoscaling, sig-network, and sig-architecture.
In practice, the working group serves as a coordination layer. We don't own code directly; instead, our deliverables take the form of KEPs and implementations that live in the respective SIGs. What we provide is a unified forum where the people building the scheduler, the kubelet, the autoscaler, and the network plane can design together rather than in isolation.
Why is this necessary? Consider a simple example: a user requests a set of GPUs that need to communicate via NVLink. That requirement involves the scheduler (place the pods on the right nodes), the kubelet (configure the devices and expose them to the container), and potentially autoscaling (provision the right node type if none exists).
If those three groups design independently, you end up with inconsistent abstractions, duplicated logic, and integration bugs that only surface in production. The working group ensures that a single coherent API and data model flows through all of these components.
The cross-SIG model also means that design decisions are reviewed from multiple angles. Someone from sig-scheduling will catch scheduler complexity that a sig-node contributor might overlook, and vice versa. It slows down individual decisions slightly, but produces much more robust outcomes.
Current focus areas
With DRA now generally available, the working group’s focus has expanded to enable more advanced scheduling models, shared semantics, operational visibility, and support for increasingly complex hardware topologies.
NF: What are some of the key initiatives or deliverables the working group is currently focused on?
KK: We maintain a project board at Kubernetes Project Board with real-time tracking of our initiatives and their progress.
PO: The scope and feature set of core DRA were intentionally limited to enable graduation to GA within a reasonable time. Additional KEPs add more features, on their own schedule. Those fall roughly into three categories:
- Extend the expressiveness of DRA to support more complex devices and scheduling scenarios.
- Support day two operations like health monitoring.
- Improve multi-node support, primarily by integrating with workload-aware scheduling.
In addition to the project board, we also maintain a table which summarizes all the KEPs which are currently in flight. This is the status for 1.36; more are likely to be added for 1.37:
KEP Description Release 1.32 1.33 1.34 1.35 1.36 4381 DRA: Structured Parameters Beta Beta Stable 5004 DRA: Extended Resource Requests via DRA Alpha Alpha Beta 4817 DRA: Resource Claim Status Alpha Beta Beta Beta Beta 5018 DRA: Namespace Controlled Admin Access Alpha Beta Beta Stable 5055 DRA: Device Taints and Tolerations Alpha Alpha Alpha Beta 4816 DRA: Prioritized Alternatives in Device Requests Alpha Beta Beta Stable 5075 DRA: Consumable Capacity Alpha Alpha Beta 4815 DRA: Partitionable Devices Alpha Alpha Alpha Beta 5304 DRA: Attributes Downward API Alpha 5729 DRA: ResourceClaim Support for Workloads Alpha 4680 Resource Health Status in Pod Status Alpha Alpha Alpha Alpha Beta 5517 DRA: Native Resource Requests Alpha 5677 DRA: Resource Availability Visibility Alpha 5007 DRA: Device Binding Conditions Alpha Alpha Beta 5491 DRA: List Types for Attributes Alpha NF: One of the core challenges is efficient device utilization and sharing. What progress is being made in this area?
JB: Good question. One way to think about it is what we are doing in the two primary APIs: ResourceClaim and ResourceSlice.
The ResourceClaim API is how the user asks for devices. We have built some features that allow the user to be more flexible in their requests. For example, instead of asking for a specific model of GPU, they can ask for a GPU with at least a certain amount of memory. Or they can ask for a list of alternatives: "I’d like one A100 (80GB) GPU, but if you don’t have it, I’ll take 2 A100 (40 GB) GPUs." This gives the scheduler some options to satisfy the request, which can lead to better obtainability and utilization of hardware that otherwise would not be selected.
The ResourceClaim API allows users to explicitly share devices. You can point multiple containers (in the same or different Pods) at a ResourceClaim; this allows the devices allocated by that claim to be used in all of those containers, if the device supports it.
The ResourceSlice API is how vendors model and advertise their devices. This is where we implement support for other sharing models. For example, we have a way to represent "overlapping partitions", enabling the scheduler to dynamically select a MIG partition, and make any overlapping MIG partitions unavailable automatically. This works well in combination with a request like “give me any GPU with 20GB or more of memory” - the scheduler can satisfy that with a MIG or a real GPU.
Some features require changes in both. We have another sharing method we call “consumable capacity”. In the explicit sharing case described above, a user needs to point containers at the same ResourceClaim; there is one ResourceClaim shared amongst several containers and Pods. With consumable capacity, the device sharing works more like how Pods share a Node. The user creates a ResourceClaim that asks for a certain amount of resources, for example, “I need a NIC with 2Gbps of bandwidth”. The scheduler knows that there is a NIC with 40Gbps of bandwidth available, and so it allocates 2Gbps out of that 40Gbps and gives it to that ResourceClaim. In this case, each Pod has its own ResourceClaim, but the underlying device is shared between those claims. It’s up to the on-node DRA driver to properly set up the device for this sort of sharing (in the NIC case, likely by creating a subinterface). We call this “platform-mediated sharing” to differentiate it from the explicit "user-mediated sharing".
Real-world impact
While much of the work is deeply technical, the underlying goal is practical: enabling Kubernetes to better support real-world AI/ML and hardware-intensive workloads at scale.
NF: What are the biggest challenges users face today when running hardware-intensive workloads (like AI/ML) on Kubernetes?
PO: Such workloads depart from traditional container workloads in several ways: they may consist of multiple communicating pods which all need to run at the same time (“gang scheduling”). They are often long-running and expensive to initialize, and their performance is sensitive to where they run (topology within a node and interconnects between nodes for multiple pods). The Kubernetes scheduler traditionally has not supported either of this well because it schedules one pod at a time and is unaware of the topology within a node. Several external schedulers try to fill this gap, which often isn’t ideal, in particular when the Kubernetes scheduler schedules other pods to the same cluster.
NF: How should platform engineers think about device management when designing their Kubernetes platforms?
JB: We’re still learning here, but one idea of DRA is to enable a shift to more "requirements driven" specifications. This can allow less coupling between end users that write the workload specification and the cluster administrators that set up the clusters. Instead of agreeing on labeling conventions and requiring users to understand the cluster topology, the users can specify what their workload needs, and the scheduler can figure out how to satisfy it. If we can make this work, it can make even complex workloads more portable across clusters.
Challenges and trade-offs
As with many areas of Kubernetes, increasing flexibility and expressiveness also introduces new layers of complexity, particularly around scheduling and optimization.
NF: What are some of the hardest technical challenges the working group is tackling today?
PO: There’s an inherent conflict between flexibility and scheduling complexity. The current implementation is focused on finding some solution that satisfies the requested resources, but it’s not necessarily the best one, whatever “best” means, which is also not always clear. The other big challenge is exposing node-allocatable resources (RAM, CPU) as devices with additional metadata; this is necessary to fine-tune scheduling of workloads which need perfect alignment on a node for optimal performance.
JB: Patrick’s list is good. Complex device modeling is hard, and making sure that we build the right semantics such that they apply to lots of different hardware is always tricky.
On top of that, scheduling in general is very complex and is an NP-hard problem. All the metadata and flexibility DRA adds gives the scheduler more options, which has pros and cons. More options are helpful if you are constrained in your choices, as it means you can schedule something that you otherwise could not. But it also means it is even harder to find an optimal solution when there are many possibilities in a given cluster. DRA works well in our common use cases so far, but we have a lot of work to do to improve the optimality of the chosen scheduling solution and ensure the performance of making that choice.
Looking ahead
Despite the challenges, contributors across the working group remain excited about the pace of innovation and the growing community forming around device management in Kubernetes.
NF: Looking ahead, what are you most excited about in the future of device management in Kubernetes?
KK: NVIDIA recently donated its DRA driver for GPUs to the Kubernetes project. I’m personally excited for more community members to start contributing to the project and defining its future direction.
PO: For me, it’s primarily the number of new contributors and people stepping up to help out. This poses new challenges around reviewing proposals and helping developers get those implemented and merged. It’s nice and rewarding to see others succeed, and it bodes well for the future because more people are familiar with the topic.
JB: I am excited about a lot of things. The community really has grown and has so many interesting features in the works to enable modeling of more complex devices, and to better model multi-node devices.
I am really excited to see the creative ways people will use these APIs. They were primarily designed to address "devices", but just like how "everything is a file" in Unix/Linux, the APIs themselves are quite flexible as to what they model. They really build out a more programmable scheduler, which can have interesting applications. For example, I recently prototyped using DRA to schedule pods to nodes where a large AI model is already locally cached. It’s really quite flexible, and I have great confidence in the creativity of our community, so I think we’ll see some unexpected solutions in the ecosystem.
Getting involved
NF: How can contributors get involved with the Device Management Working Group?
KK: The easiest first step is to join our mailing list at wg-device-management@kubernetes.io. Subscribing will automatically add calendar invites for our biweekly meetings to your calendar.
We have two meeting slots to accommodate different time zones:
- Europe/Americas: Tuesdays at 8:30 AM PT (biweekly)
- Asia/Europe: Wednesdays at 9:00 AM CET (biweekly)
Meeting notes, agendas, and recordings are all publicly accessible (links available from Device Management page). You can get a feel for the work in progress before attending your first meeting.
On Slack, find us in
#wg-device-managementon the Kubernetes Slack workspace. That's the best place for quick questions or to introduce yourself.For more hands-on contributions, the DRA Driver for NVIDIA GPUs is now a community project and a great place to start. It's a real-world, production-grade implementation that the broader community is now shaping together.
We welcome contributors at all levels – whether you're interested in the API design, the scheduler internals, driver development, or documentation. Come say hello.
Summary
As Kubernetes evolves to support the AI/ML revolution and high-performance computing, the work happening within WG Device Management is becoming the foundation for how modern workloads are scheduled and operated at scale.
From the graduation of Dynamic Resource Allocation (DRA) to the next frontiers of health monitoring and topology-aware scheduling, this group is effectively rewriting the "handshake" between software and hardware.
If you’re interested in shaping the future of hardware-aware orchestration, now is the perfect time to get involved. Whether you want to help refine the API, build out drivers, or improve documentation, the working group welcomes all levels of experience and perspectives from across the community.